Kenya Export Data

Kenya Export Data

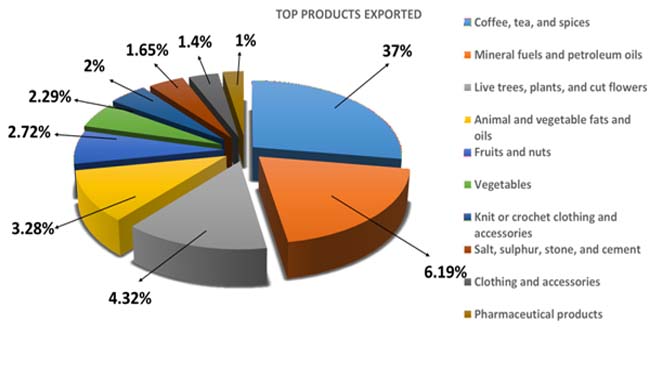
Kenya, with its base on the mainland of Africa, extending up to Uganda and Tanzania in the west and southwest, is trying to diversify its export portfolio to maintain compliance with the increasing global demand rate. Kenya Export Bill of Lading Data lists the integrity of the country into global supply chains and the export specialization of the nation regarding coffee products as the factors supporting the trade hike.

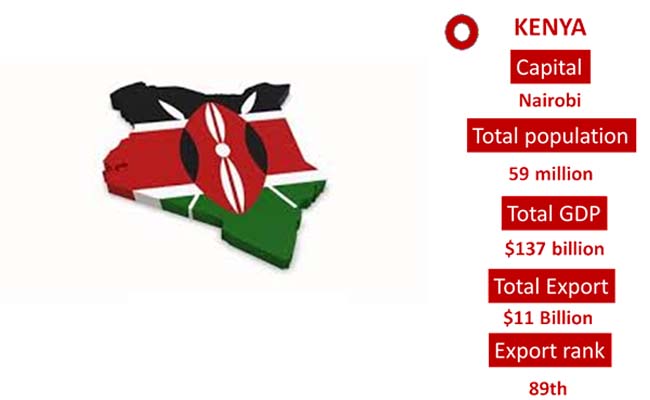
The expansion of agro-processing industries and the rising value-added exports are contributing to the trade stability. Kenya has recorded a total export valuation of 11 billion US dollars in 2025, with a nominal export ranking of 89th on a global scale. The trade agreements and the government promotion policies are popular for supporting the stability of foreign exchange earnings, says Kenya Export Data.

89th

Kenya Export Trade Statistics list the country as the 89th top global exporter because of the limited export basket.

0.05%

Kenya representatively accounts for 0.05% of the global export trade share.

Uganda

Kenya Export Trade Data represented Uganda as the top export trade partner, accounting for almost 13% of the total export revenue earnings.

Black Tea

Kenya's most exported category of trade in 2025 is black tea, as per Kenya Export Trade status.


Top 10 Export Products of Kenya

Coffee, cut flowers, fresh vegetables, and refined petroleum are some of the traded categories as per the Kenya Trade Data. As presented by the Kenya export customs trade data, the topmost variants of goods exported from the nation in 2025 are,

  • Coffee, tea, and spices (HS Code 09): 37% ($ 2.87 billion)
  • Mineral fuels and petroleum oils (HS Code 27): 6.19% ($ 1.2 billion)
  • Live trees, plants, and cut flowers (HS Code 06): 4.32% ($ 1 billion)
  • Animal and vegetable fats and oils (HS Code 15): 3.28% ($ 728 million)
  • Fruits and nuts (HS Code 08): 2.72% ($ 568 million)
  • Vegetables (HS Code 07): 2.29% ($ 498 million)
  • Knit or crochet clothing and accessories (HS Code 61): 2% ($ 325 million)
  • Salt, sulphur, stone, and cement (HS Code 25): 1.65% ($ 268 million)
  • Clothing and accessories (non-knit) (HS Code 62): 1.4% ($ 192 million)
  • Pharmaceutical products (HS Code 30): 1% ($ 185 million)
Product Image
Product Image

Top 10 Export Trading Partners of Kenya

Kenya Export Market Research Data represents the strengthening position of the country as a result of the tea, coffee, and cut flowers' contribution to the portfolio. As presented by the Kenya Export Global Trade Data, the topmost trade partners benefiting the export economy of the nation in 2025 are,

  • Uganda— 18%, (US$ 2 BILLION)
  • United Arab Emirates (UAE)— 12%, (US$ 1.28 BILLION)
  • United States (USA)— 10%, (US$ 819 MILLION)
  • Pakistan— 8.19%, (US$ 671 MILLION)
  • Netherlands— 6.59%, (US$ 543 MILLION)
  • Tanzania— 5.2%, (US$ 465 MILLION)
  • United Kingdom (UK)— 4.56%, (US$ 326 MILLION)
  • Rwanda— 3.28%, (US$ 243 MILLION)
  • Democratic Republic of the Congo (DRC)— 2.69%, (US$ 178 MILLION)
  • South Sudan— 2%, (US$ 108 MILLION)

What Details Contain In Kenya Export Data?

Our services on Kenya Export Data can be considered as one of the most valuable assets towards your trade expansion. All the information necessary for staying competitive, like the total amount of shipments, HS code, price ranges, trade partners, and currency rates, is highlighted in a reliable way. Users can directly access the set of details required within specific titles, like “Kenya Export Trade Statistics”. The data set highlights the proper growth rate of the research analysts as it helps them maintain their trade alliance as per the global trade regulations.

Irrespective of the type of business firm, if any user is facing difficulties in solving the complexities of global trade. They can simply refer to the trade assets like " Kenya Export Trade Analysis”. Businesses can truly craft their market entry strategies with proper information on the trade outputs of the targeted country. The data sets highlighted are extracted from the active customs intelligence provider with their latest invoices and trade details.

Benefits of Kenya Export data in your business

  • Helps you acknowledge the latest shipments of the targeted country.
  • Promotes your market entry strategies.
  • Keeps you updated with the latest data-driven insights.
  • Caters to the needs of your market expansion with exact shipment details.
  • Enhances your trade ranking with a strong trade database.

YOU MAY BE INTERESTED IN OTHER AFRICA COUNTRIES IMPORT EXPORT DATA

Frequently Asked Questions

The export trade value of Kenya in 2025 is 11 billion US dollars.

Uganda is the top export trade partner of Kenya in 2025.

Tea products are the top exported product of Kenya in 2025.

The global export trade rank of Kenya in 2025 is 89th.

Import Globals “Kenya Export Data” is a beneficial choice for business growth because it crafts the market entry strategies of the business holders.

Ask for Kenya Export Sample Data and Demo

Whatsapp
TOP